
Google Analytics 4 (GA4) is a crucial tool for website owners and digital marketers. By analyzing the right metrics, you can better understand user behavior, optimize content strategy, and improve conversion rates. In this article, we will explore 12 important metrics in Google Analytics 4 and why they are essential for your website’s success.
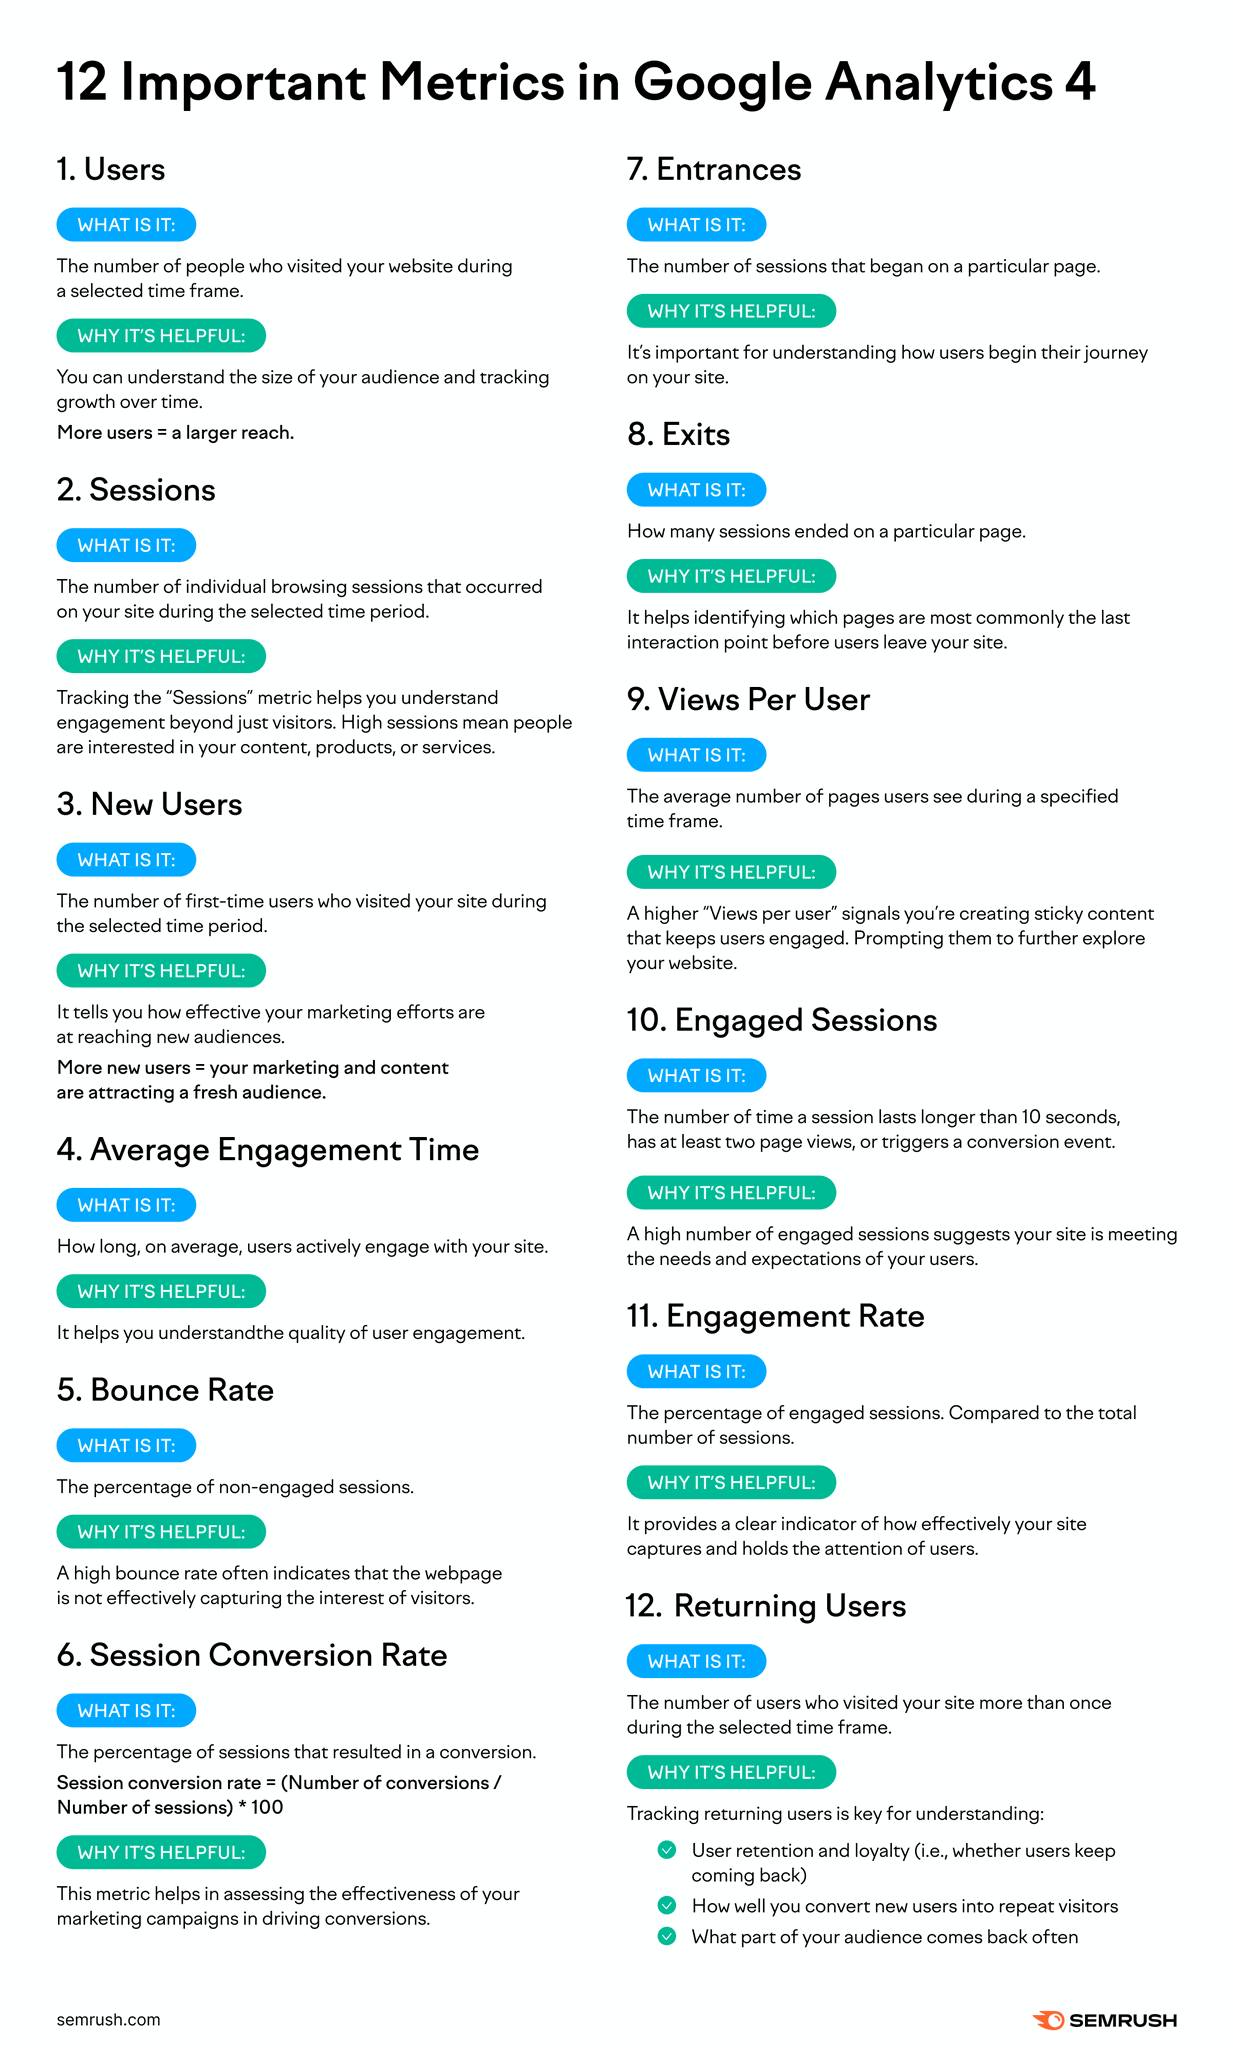
1. Users
What is it?
The number of people who visited your website within a selected time frame.
Why is it helpful?
- Helps you understand the size of your audience and track growth over time.
- More users = greater reach.
2. Sessions
What is it?
The total number of browsing sessions that occurred on your website during a specific period.
Why is it helpful?
- Indicates user engagement beyond just visits.
- A high number of sessions means people are interested in your content, products, or services.
3. New Users
What is it?
The number of first-time visitors to your site within the selected time frame.
Why is it helpful?
- Measures the effectiveness of your marketing efforts in attracting a new audience.
- More new users = successful marketing and fresh audience growth.
4. Average Engagement Time
What is it?
The average time users actively engage with your website.
Why is it helpful?
- Helps you evaluate the quality of user engagement.
- A higher engagement time indicates valuable and captivating content.
5. Bounce Rate
What is it?
The percentage of non-engaged sessions (users who left the site without interacting).
Why is it helpful?
- A high bounce rate often suggests that the webpage isn’t effectively capturing visitors’ interest.
- Helps identify pages that need improvement.
6. Session Conversion Rate
What is it?
The percentage of sessions that resulted in a conversion.
🔢 Formula:
Session conversion rate = (Number of conversions / Number of sessions) × 100
Why is it helpful?
- Assesses the effectiveness of your marketing campaigns in driving conversions.
- A high conversion rate indicates a well-optimized website.
7. Entrances
What is it?
The number of sessions that began on a particular page.
Why is it helpful?
- Helps you understand how users start their journey on your site.
- Allows you to optimize entry pages for better user retention.
8. Exits
What is it?
The number of sessions that ended on a particular page.
Why is it helpful?
- Helps identify which pages are the most common last interaction points before users leave your site.
- Allows you to improve these pages to retain visitors longer.
9. Views Per User
What is it?
The average number of pages users view within a specific time frame.
Why is it helpful?
- A higher “views per user” metric indicates engaging content that keeps users exploring your website.
- Encourages further interaction and discovery of your content.
10. Engaged Sessions
What is it?
The number of sessions that last longer than 10 seconds, have at least two page views, or trigger a conversion event.
Why is it helpful?
- A high number of engaged sessions suggests that your site meets user expectations and needs.
- Increased engagement leads to higher conversions and customer satisfaction.
11. Engagement Rate
What is it?
The percentage of engaged sessions compared to the total number of sessions.
Why is it helpful?
- Provides a clear indicator of how effectively your site captures and retains users’ attention.
- A higher engagement rate means a better user experience.
12. Returning Users
What is it?
The number of users who visited your site more than once during the selected time frame.
Why is it helpful?
Tracking returning users helps you understand:
✅ User retention and loyalty – Do users keep coming back?
✅ How well you convert new visitors into repeat users
✅ Which audience segment revisits most often
Google Analytics 4 provides a wide range of essential metrics to help you understand and optimize your website’s performance. By analyzing these 12 key metrics, you can make more informed decisions to improve content, boost user engagement, and maximize conversions.
If you want to enhance your digital marketing strategy, start by tracking these indicators and applying the insights gained to optimize your user experience! 🚀